
Powerlifting Formulas – Is Wilks Best, and What Are the Alternatives?
Introduction
At every powerlifting competition, the best lifter for each age group / weight class / gender is worked out using a certain formula. This formula takes into account, generally, three factors – gender, bodyweight & weight lifted. There have been several different formulas used, and different federations and sports use different ones, for different reasons. The accuracy and fairness of these factors have been questions, but their use is essential if we are to know who is the ‘best lifter’.
As far back as the 1930’s, it was recognised that because strength is proportional to muscle cross-sectional area and body mass is proportional to volume, isometric scaling (or the square-cube law with a 2/3 exponent) offered an intellectually pleasing theoretical model for fitting body mass to strength. Lietzke (1956) demonstrated an isometric scaling relationship between then current world records in Olympic Weightlifting and body mass. Subsequent findings by several authors showed that this relationship does not hold when including body masses over 90kg.
In retrospect, this is intuitively simple to understand. An isometric scaling relationship assumes that all lifters are perfect geometric copies of each other, scaled to different sizes, which they obviously aren’t. There are numerous anatomical differences between any two people. A few years later, Austin proposed an updated allometric model with a 3/4 exponent, which does not assume perfectly scaled copies. Nevertheless, a few researchers persisted with the 2/3 exponent and once again showed it to fit 1971 records modestly well, so long as heavier weight classes were again omitted.
Explaining this, Lyle H. Schwartz, Ph.D. says of the Hoffman formula (mentioned below):
“Imagine two balloons in the shape of a lifter, one larger than the other. If we can match the big one by blowing air into the smaller, all dimensions growing in the same proportion, then the original two balloons can be said to be similar. Body weight in similar objects increases as the cube of any length (for example height), while strength presumably depends on how big the muscles are and that increases as the square of a linear dimension. Thus, if we divide a lifter’s total by his bodyweight taken to the 2/3 power, it will correct for differences in size.”
Hoffman / Sinclair Formula
Weightlifting has the advantage over, say, boxing in that its performances are purely numeric. In the 1930s, Bob Hoffman, owner of the York Barbell Company, developed the Hoffman Formula, which attempted to neutralise the bodyweight issue when comparing performances. This worked reasonably well for a number of decades until it was generally agreed that the formula was increasingly favouring the heavier athletes. This may partly at least be explained by the fact the heavier weight categories improved much faster than the lighter ones and consequently ended up with better scores. An attempt was made at correcting the Hoffman formula, but this only held sway for a few years until Dr. Roy Sinclair developed his and was able to get it recognised by the International Weightlifting Federation.
With the passing of Dr. Sinclair, there has been some renewed discussion about the various formulae. Sinclair developed his back in 1978, deriving it from the performances of top-level weightlifters so that top performances could be displayed graphically.
The Sinclair Total is calculated by taking an athlete’s total (combined max snatch and clean & jerk) and multiplying that number by the Sinclair Coefficient. A “coefficient” is a mathematical term you might remember from algebra that basically just means “a constant number by which a variable is multiplied.” In weightlifting jargon, the coefficient is the number that Sinclair came up with to represent an athlete’s bodyweight, and the variable is the athlete’s weightlifting total.
At all points along the resulting curve there is a corresponding coefficient for each bodyweight. This coefficient is then simply multiplied by the lifter’s total in order to get his “Sinclair total.”
What that figure gives you is essentially what that lifter would have totalled if that lifter was a super heavyweight. The formula was normalised at a high bodyweight under the assumption that most lifters would like to know what they would lift if they were bigger – not smaller as Hoffman’s had done. This formula is updated every Olympiad in order to stay current. In this way, the performance of a 60kg athlete can be readily compared with the performance of a 100kg athlete. Whoever has the highest Sinclair total would be adjudged the better pound for pound lifter.
Fast forward a few years. In an effort to eliminate bias between the weight classes present in allometric models, researchers turned from theoretical models to statistical models and published formula tables (e.g., Malone, Schwartz, and Wilks) one can use to calculate relative strength. Up to now, the Wilks formula has performed the best in this regard. Unlike the previously introduced strength/mass ratio and allometric model variations, no weight class is systematically favoured or disfavoured in Wilks (although some are favoured nonetheless – more on this later) and is currently the official formula used in the IPF & British powerlifting amongst others.
Wilks
Robert Wilks, CEO of Powerlifting Australia, is the author and inventor of the formula. The following equation is used to calculate the Wilks Coefficient. The total weight lifted (in kg) is multiplied by the Coefficient to find the standard amount lifted normalised across all body weights. There are numerous different websites and apps that will calculate your Wilks score for you once you enter three different parameters, but if you are curious the formula is:
500
____________________
a + bx + cx2 + dx3 + ex4 + fx5
x being the body weight of the lifter in kilograms
Values for men are: Values for women are:
a=-216.0475144 a=594.31747775582
b=16.2606339 b=-27.23842536447
c=-0.002388645 c=0.82112226871
d=-0.00113732 d=-0.00930733913
e=7.01863E-06 e=4.731582E-05
f=-1.291E-08 f=-9.054E-08
The Wilks formula is not, however, based on published data and has yet to be extensively critically evaluated. Vanderburgh PM, decided to examine how valid and accurate the Wilks formula was in practical terms. This was performed by;
- Examining residuals bias to verify that the adjusted score does, in fact, lead to no systematic bias based on body mass and;
- By applying a more theoretically supportable allometric model to the same data and comparing the fit with the Wilks approach.
Subjects were the current (1999) men’s and women’s world record holders as well as the top two performers for each event in the IPF’s 1996 and 1997 World Championships (a total of 30 men and 27 women for each lift).
Results of data analysis regarding the Wilks formula indicated that:
- There was no bias for men’s or women’s BP (Bench Press) and TOT (Total);
- There was a favourable bias toward intermediate weight class lifters in the women’s SQ (Squat), with no bias for men’s SQ; and
- There was a linear unfavourable bias toward heavier men and women in the DL (Dead Lift). Furthermore, the allometric approach indicated a bias against light and heavy men and women which may be considered acceptable given that half as many lifters are found in the lightest and heaviest weight classes as in the intermediate weight classes.
The conclusion drawn was that when used for BP and TOT only, the Wilks formula appears to be a valid method to adjust powerlifting scores by body mass.
These results could seem odd to some people, as it is usually thought that the Wilks formula favours the lighter lifters.
Tim Henriques however, in 2016 says that the Wilks formula is ‘too wrong to use’, giving an example of two bench presses.
Those lifts were:
Lifter A: 175lbs (79.5kg) bodyweight and benched 330lbs (150kg) Wilks: 102
Lifter B: 285lbs (129.5kg) bodyweight and benched 405lbs (184kg) Wilks: 104 – Best Lifter
Wilk’s formula says that Lifter B is the best lifter. Lifter A is benching close to double bodyweight and is lifting 70kg over his bodyweight. Lifter B is lifting less than 1.5 x bodyweight and is only lifting 55kg over his own body-weight.
Henriques argues that the total pounds you are lifting over your bodyweight should normally increase as your weight increases, however is has been proven that this is not the case. Not as simply as that anyway. He states that lifter B is 110 lbs heavier than lifter A, but he only lifts an additional 75 lbs of weight. 75 / 110 = His extra weight is only adding .68 lbs lifted per lb bodyweight
For the formula to allow a lifter to gain 110 lbs of bodyweight and with only 75 lbs of added strength and then it ranks that as more impressive, that (says Henriques) is a big problem.
He goes on to offer a solution – that solution is to calculate a lifter’s ‘AS’ (Allometric Score).
Greg Nuckols explain further, stating you should expect body mass to increase faster than strength. If all of your proportions increased two-fold, you should expect to be 4 times as strong (22), while weighing 8 times as much (23) assuming your body composition was the same. If you were to plot size and strength on logarithmic scales resultant line would have a slope around 2/3, rather than 3/4.
Using this relationship, you can use the equation SxM-2/3 to give you an allometric scaling score to compare two feats of strength. For example, let’s say you wanted to compare a 300lb (136.4kg) squat at 150lbs (68.2kg), and a 405lb (184kg) squat at 220lbs (100kg).
The former would give you an allometric scaling score of 10.6266, and the latter would give you an allometric scaling score of 11.1132. So, even though the 300lb squat at 150lbs is 2x bodyweight and the 405lb squat at 220 is only 1.84x bodyweight, the 405lbs squat is a more impressive lift, given the biological reality of allometric scaling.
Just as this may seem to offer a better solution however, Vanderburgh PM. In The Journal of Strength & Conditioning Research (2000) found that results indicated that AM (Allometric Modelling) of world records for the bench press and squat are indeed void of any body mass bias and contain normally distributed residuals. However, the same cannot be said for the deadlift. Therefore, the AM approach appears to be a satisfactory method of determining the strongest body mass-adjusted men in the bench press and squat alone.
Continued use of AM to compare athletes of different body mass using BP x BM−0.57 and SQ x BM−0.60, where BP is bench press, SQ is squat, and BM is body mass, is recommended.
Wilks vs. Sinclair
Powerlifting also used the Hoffman formula in its early years, but also came to recognise its shortcomings. Several different formulas were arrived at over the years, until we now have the Wilks Formula. This formula appears to be much different from the Sinclair model if you merely look at its coefficients. This has prompted some to wonder why they are so different.
Some try to answer this question by assuming that since the nature of the lifts, their number, and manner of lifting are so much different, that it is only reasonable that a far different formula would be required.
To determine if this was right, the coefficients used by both were compared by Dresdin Archibald, a weightlifting and strength & conditioning coach from Edmonton, Canada. Each formula started with high coefficients at the lighter bodyweights and decrease toward the heavier end. This only stands to reason as the smaller lifters will need a bigger coefficient to equalise performances.
The main problem encountered with this method is that each set of coefficients was normalised at differing body weights. Sinclair normalised his at the super heavyweight level since, as mentioned, lifters were typically thought to like to see how they would do if they were larger. The Wilks, by contrast, is normalised down at the 51kg level. His formula answers the question, “What would I total if I weighed 51kg?” Now we see the problem.
In order to correct this, the Wilks figures were normalised by Archibald by simply dividing each one of them by the Wilks coefficients of the same bodyweight as Sinclair’s model. Since they all divided by the same figure, it does not change the general nature of the curve. Therefore, the two formulae can be more readily compared.
The following is a graphical interpretation of the results.
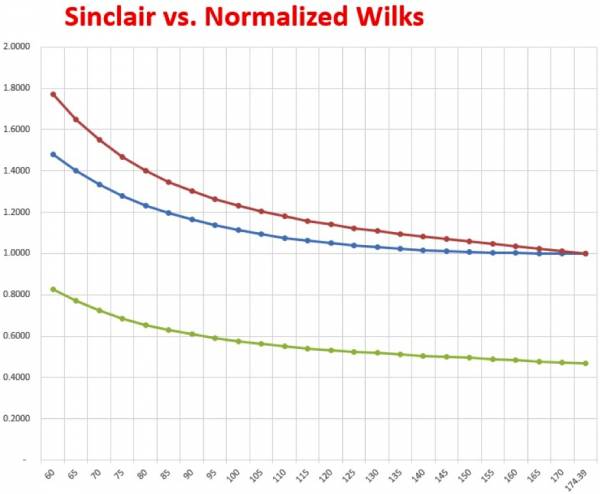
The red line at the top is the Sinclair curve.
The green line at the bottom is the raw Wilks curve.
The blue line in the middle is the normalized Wilks curve.
The X-axis numbers are the body weights.
The Y-axis numbers are the coefficients.
From this, it can be easily seen that the graphs of the Sinclair and re-normalised Wilks numbers are very similar. The Sinclair has a steeper curve than the Wilks, so the next question has to be “why?” Archibald could not give an easy answer to this.
The Fault of Correlation
Wilks based his formula on the totals results of world championships, just as Sinclair did. Some have reasoned that if a separate formula existed for each of the individual lifts that their curves would be a little steeper. This may well be true since in the sport of powerlifting the three lifts are not as well correlated as they are in the Olympic lifts. In the latter the snatch is usually about 80% of the clean and jerk, give or take only small variances. The snatch and the clean are very similar movements and differ only in the height to which they must be lifted. Therefore, one is easily predictable if the other is known.
The powerlifts are not so well correlated. Most lifters deadlift more than they squat, but not all of them do. Powerlifting has more specialists on individual lifts due to the fact that the type of body that makes for a good bench presser does not make for a good deadlifter. It frequently happens that bench and deadlift record holders do not do so well in the total. Those who do better in the total are more well-rounded lifters. This tends to flatten out their totals compared to what the three individual record lifts would add up to.
Archibald goes onto say that he is not sure all this is the reason for the slight differences in the formulas, what is more important is their similarities. They are not vastly different as some people assume them to be just because their coefficients appear so. Their underlying premises are the same – strength potential as one increases in size is a logarithmic function not an arithmetic one.
What both demonstrate is that the pound to pound ratio is not fixed, neither is it arithmetic. It is logarithmic – whether we like it or not. A logarithmic scale is based on orders of magnitude, rather than a standard linear scale, so the value represented by each equidistant mark on the scale is the value at the previous mark multiplied by a constant.
What other formulas are there?
Reshel / Glossbrenner
For most of the existence of the Australian Powerlifting Federation, the Reshel Formula was used to determine the best lifter, created by a former APF Technical Officer, Greg Reshel. Recently, however, the APF adopted the new Glossbrenner Formula, created by Powerlifting USA Statistician Herb Glossbrenner. This formula, however is not really a new formula as much as a combination of two older ones. It took the average of the coefficients from the Schwartz, and IPF formula, the Wilks. Herb Glossbrenner contended that the Reshel too heavily favoured the very light weight lifters, and was outdated. He also contended that, while they were both okay formulas, the Schwartz formula favoured the lighter lifters and the Wilks favoured the heavier lifters. So, he took the average of the two to balance them out.
Schwartz /Malone
Schwartz says “Since powerlifting was still a young sport in the early 1970’s there was uneven development in the three lifts on the part of most self-trained athletes. I compensated for such unevenness by creating artificial ‘best’ totals by adding together the current records in the individual lifts. A ‘best’ total would have been achieved by that ideal lifter who could match the best performances to date in all three powerlifts. Then I fitted these data to an artificial curve and picked off numbers from the curve”
for each bodyweight. To use the Schwartz Formula, a person would use the table of numbers and correct just as was done in weightlifting. And it worked (to a certain degree), lifters of all sizes could now be compared. The table can be found here: http://www.apa-wpa.com/SCHWARTZMALONEFORMULA.html
But then something very new appeared on the scene. Women began to claim a spot on the powerlifting platform and their results, didn’t seem to fit the formula, It was not long before Pat Malone, using a procedure similar to Schwartz, made the appropriate adjustments. The Malone Formula corrected for bodyweight when women competed against women and seemed to do a good job of it.
Is there a better way of doing it?
Robert Frederick says that it is almost predetermined that the relative strength overall winner of a powerlifting competition will come from the men’s open group. That means that it’s actually favouring absolute strength, something it was not supposed to do. For a formula based on the goal of eliminating bias in order to compare the relative strength between two different lifters, it seems Wilks was only partially successful.
Let’s turn to some data to help visualise the issue. Frederick looked at every 1st place finish at an IPF World Championship since 2012. That provided enough data (n=383) to ensure robust results which should not need to be updated if a new record is set somewhere. Next, he averaged the Wilks score in every group and then plot them out on a radar chart. If there is no bias between groups we would expect to see the data points trace out a circle around the chart.
Figure 1: Age and Gender Bias in Wilks Scores
Three models were compared using the same IPF data shown in figure 1. In addition to noting biases, the coefficient of variation (CV) were also measured — a measure of how close the model predictions are to actual values, where lower is better — and the amount of variation in the data explained by the model (R-Squared).
| MODEL | BIASES | CV | R-SQUARED |
| Ratio | Gender, Age, Weight | 25.7 | 0.50 |
| Allometry | Age, Weight | 3.3 | 0.71 |
| Wilks | Gender, Age | 2.2 | 0.95 |
The ratio method performs quite poorly and allometric models are a big improvement. Meanwhile, it appears Wilks does a good job in making accurate predictions and accounting for the vast majority of the variability. It does, however, have those gender and age biases we pointed out.
It turns out that only men’s weight classes follow the expected circular path around the chart. There is a significant gender bias favouring men, as well as an age bias favouring the Open class.
How can this be corrected?
Starting with the basics, here are some factors we know affect strength (at least in terms of powerlifting results).
Age / Gender / Weight / Height / Muscle mass / Training age / Muscle architecture / Body segment lengths / Other stuff
It turns out that only the first six variables account for 89% of the variability in strength between individuals in a general population of weight training adults. So, if a new relative strength model is to be created, at least the first six variables need to be used right? Not necessarily.
Yes, we do need at least six for a general population. But the population Frederick was looking at specifically was the population of 1st Place finishers at IPF World Championships. We want a formula that determines the ‘best lifter’. For this population, additional training time is not going to lead to significant increases in strength. They are already near their maximums. Training age matters for beginners, where an extra year of training matters a lot. But after 10 years of training, one more year doesn’t have remotely near the same impact. For his sample population of 1st place finishers, training age is no longer a relevant factor. Additionally, it was deemed that they have accumulated as much muscle mass on their skeleton as they are going to. Their height has essentially determined their weight class. For this population, almost all the variability in results is explained by only the first three variables– age, gender, and weight.
So, Frederick tried to create a relative strength model that utilised these three variables from the ground up. Once again, setting 100 to be the average 1st Place finish and hoping to see the blue data line track a circle around the chart.
Figure 2: Reduced Bias Strength Index
That now looked much better, and we are almost seeing a blue circle. There is almost no visible bias — within error — between all classes except for the age classes. However, some of the Masters 1 lifters decided to lift in the Open class. Which lifters were those? The top half. If you place those Masters 1 lifters back into their class, the class as a whole rises and the Open class decreases a proportional amount. Do that here and the nearly perfect circle that we’re looking for would be seen (with Masters 2 being slightly favoured). That means our ‘best lifter’ can now emerge from anywhere and we’ve got a much more exciting sport to watch and participate in.
So, with biases off the to-do list Frederick then went back to check the other measures of model quality — the coefficient of variation and r-squared. It’s quite possible that fixing one thing breaks something else. This is what he found:
| MODEL | BIASES | CV | R-SQUARED |
| Ratio | Gender, Age, Weight | 25.7 | 0.50 |
| Allometry | Age, Weight | 3.3 | 0.71 |
| Wilks | Gender, Age | 2.2 | 0.85 |
| Strength Index | None | 1.6 | 0.94 |
The Strength Index gives us the most accurate scores, as indicated by the lowest CV, as well as matching Wilks in terms of accounting for variation. It seems like we could be looking at the next generation of relative strength models.
So where do we go from here?
This isn’t clear, although these results show that there are other means to get a fairer spread of data when looking at first place finishers at the world championships we don’t know if it would work as consistently with results from national or regional competitions where the standard or lifting is much more variable. It should also be noted that Frederick, as mentioned above, used only three variables when coming to his conclusions and generating his new ‘strength index’. It was said that at least six variables should be used for the general population.
What all this does point to however, is that the probably is a better way of calculating who’s the best lifter from a group of competitors than the current Wilks formula. This will need more research and trials.
Even if a better way is found, the question will be; will Wilks be gotten rid of? Will the powerlifting world accept the change, and will it be used unanimously – or will certain countries / federations use different formulas? We will wait and see.
References
http://allaboutpowerlifting.com/wilks-formula-wrong-use/
https://en.wikipedia.org/wiki/Wilks_Coefficient
https://barbend.com/sinclair-coefficient-formula-total/
https://breakingmuscle.com/fitness/pound-for-pound-lifting-who-is-stronger-wilks-vs-sinclair
http://www.strongur.io/can-we-do-better-than-wilks-absolutely/
http://library.la84.org/SportsLibrary/IGH/IGH0804/IGH0804g.pdf
http://chicagopowerlifting.com/FAQ.html#BestLifter
https://www.powerliftingwatch.com/node/8748
https://www.ncbi.nlm.nih.gov/m/pubmed/10613442/#fft
https://www.sciencedirect.com/science/article/pii/S1738573315301169
https://www.strongerbyscience.com/whos-the-most-impressive-powerlifter/
Vanderburgh PM & Batterham AM, Medicine and Science in Sports and Exercise. (1999)

BK
February 18, 2023 at 7:19 pmThanks for this insight! Greatly appreciated!