Genetic Precursors to Strength
Introduction
Genetics explain a lot of the differences in strength and muscularity between person to person. Specifically, the size of your frame, how many muscle fibres you’re born with, and how well you respond to training essentially separate you from your training partner or someone who can squat 400kg.
This leads us to think; Am I really in control of my life, or am I just a product of my DNA and my environment? Well, it’s a bit of both. As we will see, genetics play a large part (around 55%) determining strength, and environmental factors including upbringing, diet and puberty make up the rest.

What makes up Strength?
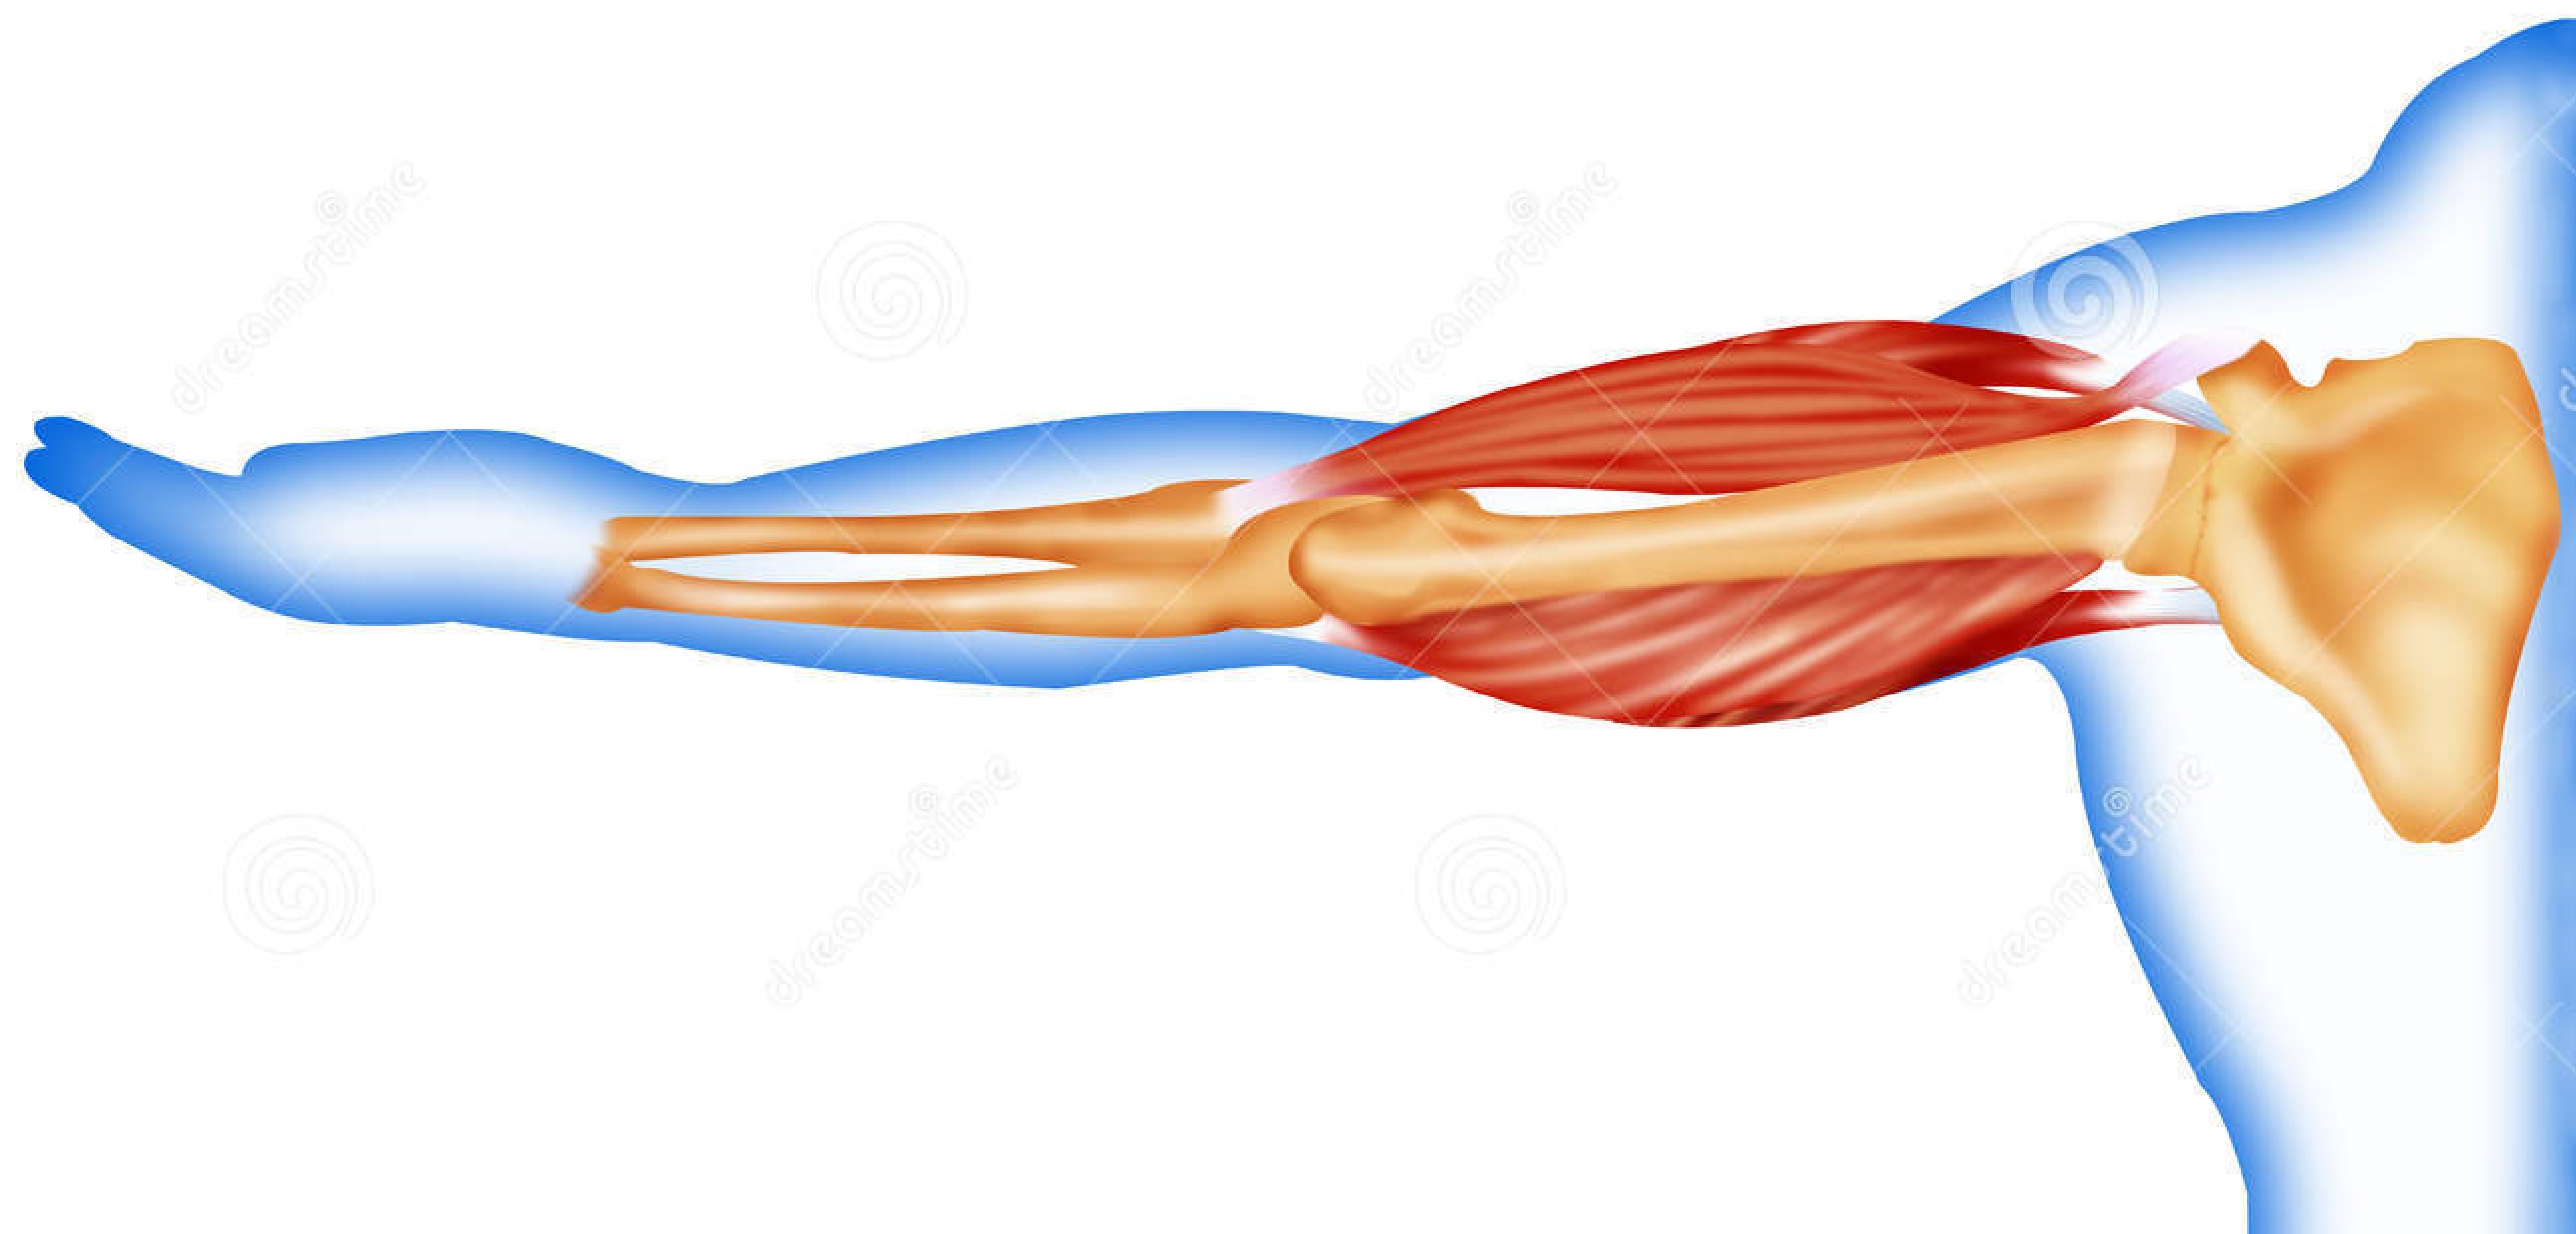
Strength is a function of neural factors and muscular factors. Once you’ve hit a point of diminishing returns for the neural factors, your strength potential will be determined by how much muscle you can build. This too however depends on genetic factors.
On one hand, we have the notion that’s deeply ingrained into the Western psyche that hard work is the only thing that separates the best from the rest; we start life on a level playing field, and the choices we make are the sole determinants of our outcomes. This was the cornerstone of John Locke’s ‘tabula rasa’ (blank slate) philosophy that was at the cornerstone of the enlightenment, and it’s been bolstered in recent years by Malcolm Gladwell’s ‘10,000-hour rule’. The latter, which states that 10,000 hours of doing something will make you an expert at it, is not universally accepted.
On the other extreme is genetic determinism: the idea that your fate is pre-programmed by your genes and the environment that you grow up in. You may feel like you’re in the driver’s seat, but really you’re just along for the ride, slave to genes and circumstance. Both of these view-points will obviously have pros an cons if you decide to follow them, either leading to potential disappointment, or not hitting your true potential.
Genetics / Genes
In this article, “genetics” will be used as a catch-all term for all of the factors that have worked together to shape your responsiveness to training as an adult. Among these are truly genetic factors (discrete genes), genomic factors (higher level genome-wide interactions), and factors that were at work in utero and your environment in early childhood that have shaped your body and the way it responds/adapts to training (factors that aren’t purely genetic, but that have a very strong influence on the rest of your life). In effect, when the term “genetics” is used, it’s generally short-hand for “factors that shape how you respond to training that are mostly or entirely outside your control once you’re an adult.”
After all, humans share 99.9% of the same genes. Yes, there’s some variation, but it can’t be that large, can it? 99.9% is the commonly cited figure you’ll see in most textbooks. Actually, people of European ancestry got about 1.5-2% of their genes from Neanderthals, and some Aborigines and Pacific Islanders got up to 6% of their genes from Denisovans – another ancient group of hominids. However, those other groups were very similar to Homo-Sapiens (the genes themselves are very, very similar), and with another 100,000+ years of evolution and interbreeding under our belts, these slightly different ancestries likely don’t make a huge difference.
So, you’d expect us all to be almost exactly the same, right?
Well, actually, we are – at least at the level of what proteins we can make. Genetic similarities only tell you how many of the same proteins two animals can make, and most animals that function in similar ways (for example, mammals, all of whom are warm-blooded and give birth to live offspring) are necessarily going to share a lot of the same proteins. Behind the huge physical differences we see, there are lots of similarities on the cellular level. Those similarities deal with much more fundamental functions like metabolism, immune function, reproduction, digestion, and respiration, all of which are managed by a whole host of genes that we all share as humans and that we largely share with all other mammals.
Small differences make a huge impact on your phenotype (how you actually look and function), though. We share 97-99% of our genes with other primates like chimpanzees, gorillas, and baboons, 92% of our genes with mice, 44% of our genes with a fruit fly, and 26% of our genes with yeast.
Under the microscope, our DNA may only be 1% different from a chimp, or 8% different from a mouse, but at the level of the entire organism – how we look, how we think, and how we function – I think we’d all agree that the gap between humans and chimps is larger than 1%, and the gap between humans and mice is larger than 8%. Small differences (even the 0.1% difference between humans) in our DNA can mean big differences in appearance and function.
Furthermore, there are different versions of various genes that function a bit differently, while still being a part of that 99.9% similarity. For example, specifically looking at factors that would affect strength – there are two versions of the ACTN3 gene which plays a role in explosive performance. One version of the gene is beneficial for power performance, and the other version of the gene has a negative effect on power performance (but may have a positive effect on aerobic performance). So far, there are 22 genes like this that have been identified for strength/power performance, with one version of the gene being beneficial, and the other version of the gene having a neutral or negative effect. This shows that even the genes that are ‘the same’ can have huge impacts on our physical performance.
To complicate things further, on top of different versions of genes, you can also have varying numbers of the same gene.
Training Effects
Before training, about 80% of the total lean mass differences between people can be explained by genetic differences. Of course, lean mass scales with height and weight (both of which are also strongly genetically influenced), but even after controlling for height and weight, genetics still explain about half of the variation in lean mass relative to body size. Other factors related to performance are strongly influenced genetically as well. Height and skeletal structure are two, and about 45% of muscle fibre type distribution seems to be explained by genetic factors (and the non-genetic influences primarily occur during early childhood, which you also don’t have much control over).
In one study by Hubal et al (2005), 585 people trained their non-dominant arm for 12 weeks. The study involved 6 sets of curls and triceps extensions, building from 12rm loads to 6rm loads over the course of the study (linear periodisation). It wasn’t explicitly stated, but it’s assumed the training sessions were only once per week. On average, the participants’ biceps got about 19% bigger and their 1rm biceps curl increased by about 54%.
However, the range of responses was huge. Several people’s biceps actually got slightly smaller (even though they were untrained at the start of the study), while one person’s got 59.3% larger. See Figure 1 below.
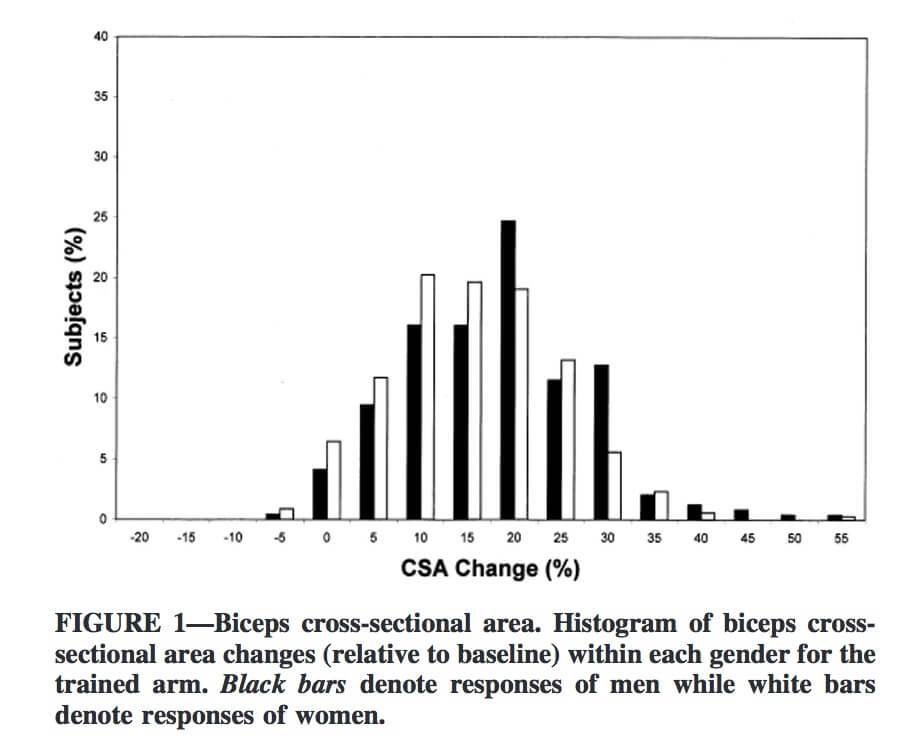
The variability in strength gains was even larger, from several people not gaining any strength at all, to one person increasing their 1rm biceps curl by 250%.
Another study by Bamman et al. looked at quad growth. This one also used untrained subjects, but it employed a more intense training program – 3 sets of 8-12 (to failure) for squats, leg press, and knee extensions, 3x per week, adding weight when possible for 16 weeks.
After training, they split the 66 subjects into three groups: “non-responders,” “modest responders,” and “extreme responders.” The non-responders and extreme responders were the quarter of participants who gained the least and most amount of muscle (17 per group), while the modest responders were in the middle one-half (32 people).
On average, the non-responders’ muscle fibres didn’t get meaningfully bigger or smaller. The modest responders’ muscle fibres got about 28% bigger on average. Not too shabby for 16 weeks of training. The extreme responders’ muscle fibres grew 58% on average. They got roughly twice the results of the modest responders.
In fact, one person’s muscle fibres actually grew dramatically more than even the average extreme responders.’
Assuming that person’s average muscle fibre cross-sectional area was near the extreme responders’ group mean to begin with, that would mean his/her muscle fibres got 75-80% larger in only 16 weeks.
Interestingly, group differences for strength gains were much smaller. While the extreme responders’ muscle fibres grew twice as much as the modest responders’, and the non-responders’ muscle fibres didn’t grow at all, total strength gains were fairly similar. The non-responders’ and modest responders’ 1rm leg extensions increased by about 35-38% over the course of the study, while the extreme responders’ 1rm got about 45% stronger. The extreme responders still did the best, but the gap was much smaller.
What’s telling, though, is the pattern of strength gains. All the groups gained a pretty similar amount of strength in the first 8 weeks. However, the non-responders made almost 80% of their total strength gains in the first 8 weeks of the study and didn’t get much stronger thereafter, while the modest responders and extreme responders only made about 2/3 of their total strength gains in the first 8 weeks and were still gaining strength at a solid pace after 16 weeks.
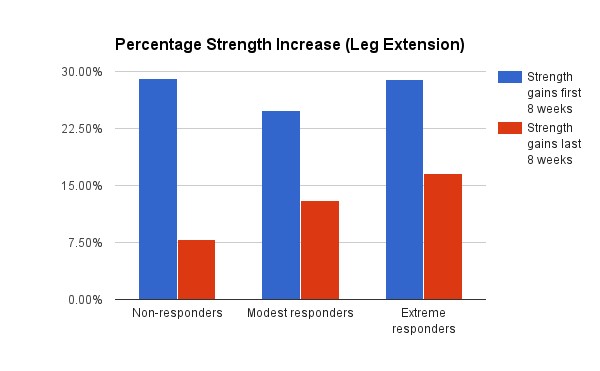
This makes sense: Most of the initial strength gains you make in response to training revolve around neural adaptations; you do gain muscle, but you also get much better at producing force with the muscle you already have. The non-responders could gain strength at the same pace as the modest and extreme responders for the first 8 weeks because their lack of hypertrophy wasn’t much of hindrance yet. However, after another two months, only the two groups with robust muscle growth were able to keep adding strength quickly.
Another study by Davidsen follows this same trend. This study is noteworthy because it was one of (if not the only one) specifically studying the range of hypertrophy/strength responses where nutrition was controlled and monitored.
Out of a group of 56 trainees, the researchers compared the top and bottom ~20% of responders. The high responders gained roughly 4x as much lean mass over the 12-week training program: 4.5kg (~10lbs) versus a bit over a kilo (2-2.5lbs) of lean mass for the low responders. The high responders’ type I muscle fibers grew 16% versus 6% for the low responders, and the high responders’ type II muscle fibers grew 26% versus 8% for the low responders.
Much like the previous study, though, differences in strength gains were much smaller. The high responders’ leg press and leg extension strength did increase slightly more than the low responders’ did, but the differences didn’t reach statistical significance (it was close for leg extension, though: 72% vs. 59%, p = 0.075).
Testosterone
Testosterone, a steroid hormone, is an index of the hypothalamic-pituitary-gonadal axis, a primary neuroendocrine system involved in advancing puberty and regulating human behaviour. Variations and risks of low testosterone levels in men are mostly due to genetics. Testosterone is the principal male sex hormone and a potent anabolic steroid. It exerts a variety of important physiological effects on the human body, and is also present in women – but at much lower levels.

Genetics play an important role in the variation in, and risk of, low testosterone concentrations in men. A study by the CHARGE Sex Hormone Consortium, published in the open-access journal PLoS Genetics, is the first genome-wide association study to examine the effects of common genetic variants on serum testosterone concentrations in men.
Most of the risk markers were found within a single gene, called the sex hormone-binding globulin gene. This gene codes for a protein that binds to testosterone. An increase in the levels of this protein might lead to a decrease in the amount of testosterone in the blood, Prof. Claes Ohlsson from the University of Gothenburg stated.
Among adolescent males, individual differences in testosterone were substantially heritable (55%), and significantly associated with self-reported pubertal status (controlling for age) via common genetic influences. In contrast, there was no heritable variation in testosterone for females, and testosterone in females was not significantly associated with pubertal status after controlling for age.
Ohlsson explains:
“This is the first large-scale study to identify specific genes for low serum testosterone concentrations. It is very interesting that the genetic contribution of the identified genetic variants to testosterone concentrations is substantial.”
In contrast, infant studies have found no genetic variation in testosterone assessed using cord blood or saliva; rather, environmental factors accounted for all the variation in testosterone in infancy. Adolescence may be a critical developmental period when genetically-driven individual differences in testosterone emerge and possibly diverge between sexes, resulting in sex differences in behavioural organisation. This is particularly interesting as it could lead to the thought that the testosterone level rise during puberty could be changed, influenced and increased/decreased by upbringing and developmental early childhood.
Increases in testosterone are necessary for male physical development, driving the emergence of secondary sex characteristics (e.g., height, muscle mass, voice register) that are characteristic of male puberty (Hiort, 2002).
What’s my muscular potential?
There have been a variety of ways proposed to predict someone’s muscular potential. They all give reasonably similar predictions, but there are two that are regarded as being notably better than the others, and only one of them is user-friendly;
The Berkhan/Leangains Model
This one’s also probably the simplest. Martin Berkhan developed this model based on his observations concerning the stage weights of drug-free bodybuilders.
Weight (kg, in shredded, stage-ready condition) = height in cm – 100
To convert that to fat-free mass, you’d multiply the result by .95 (to account for 5% body fat in stage-ready condition).
So, if you’re 5ft 3in (160cm), you should expect to be about 60kg, with 57kg of lean mass. Whereas, if you’re 6ft 2in (188cm) you should expect, according to this method, to be 88kg, with 83.6kg lean mass.
A separate study calculated the fat-free mass index (FFMI) in a sample of 157 male athletes, comprising 83 users of anabolic-androgenic steroids and 74 nonusers. FFMI (and adjusted FFMI) are defined by the formulas:
FFMI = (Lean / 2.2) / ((Height in ft x 12.0 + in) x 0.0254)2 x 2.20462
Adjusted FFMI = FFMI + (6.1 x (1.8 – ((Height in ft x 12.0 + in) x 0.0254)))
This study then added a slight correction of 6.1 x (1.80 m – height) to normalise these values to the height of a 1.8-m man. The normalised FFMI values of athletes who had not used steroids extended up to a well-defined limit of 25.0. Similarly, a sample of 20 Mr. America winners from the pre-steroid era (1939–1959), for whom was estimated the normalised FFMI, had a mean FFMI of 25.4. By contrast, the FFMI of many of the steroid users in the sample easily exceeded 25.0, and that of some even exceeded 30. Thus, although these findings must be regarded as preliminary, it appears that FFMI may represent a useful initial measure to screen for possible steroid abuse, especially in athletic, medical, or forensic situations in which individuals may attempt to deny such behaviour.
So with the previous example of a 6ft 2in person, at 5% bodyfat;
FFMI =
(83.6/2.2) / ((6×12.0 + 2) x 0.0254)2 x 2.20462
= (38 / (74 x 0.0254)2) x 2.20462
= (38 / 3.5328961) x 2.20462
= 10.756047 x 2.20462
= 23.712996
Adjusted FFMI =
23.712996 + (6.1 x (1.8 – ((6 x 12.0 + 2) x 0.0254)))
= 23.712996 + (6.1 x (1.8 – (74 x 0.0254)))
= 23.712996 + (6.1 x (1.8 – 1.8796))
= 23.712996 + (6.1 x (-0.0796))
= 23.712996 + (-0.48556)
= 23.227436
A lot of people have formed the idea that an FFMI of 25 is the maximum possible without drugs, largely based off of the study by Kouri et Al.
Historical Steroid Use, relating to FFMI
It is widely believed that the majority of anabolic steroid use in the US lifting community began in the late 1950s once superior synthetic steroids were produced. However, top American lifters and bodybuilders experimented with testosterone as of 1954. Finally, testosterone use likely began as early as the late 1940s among Soviet lifters, considering the institutionalised use by their weightlifting team at the 1952 Olympics.
However, just because something was not recorded or corroborated does not mean it couldn’t have occurred. The Mexican hormone industry began producing more affordable testosterone in 1945, coinciding with increased public awareness of testosterone’s potential with the publication of ‘The Male Hormone.’ Thus, depending on the level of scepticism applied, one can view the 1939-1959 Mr. America FFMI’s from two perspectives. The highly sceptical can view only the 1939-1944 winners as being almost certainly drug-free, while the moderately sceptical can view the 1939-1953 winners as being almost certainly drug free.
Bert Goodrich – winner of Mr America 1939
If we accept the 1939-1944 winners as natural, the average FFMI is 24.9, with the highest reported at 27.3. Applying moderate scepticism and accepting the 1939-1953 winners as natural, the average FFMI is 25.6, with the highest reported at 28.0. These means are not much different from the 1939-1959 group mean. In fact, the FFMIs have been analysed to determine if they were increasing over time. It was noted: ‘There was no significant trend towards increased FFMI among the Mr. America winners over a 20-year span from 1939 to 1959 (slope = 0.044 FFMI units/yr; p = 0.44 by regression analysis).’ Thus if drug use was occurring, perhaps it wasn’t frequent or effective enough to significantly affect the aggregate FFMI.”
Muscle to Bone Ratio & Muscle Mass Potential
Anthropometrics researcher Francis Holway developed a theory regarding this area of research. He was quoted in David Epstein’s The Sports Gene and his idea is that the amount of muscle you can gain is limited by how much bone you have. To quote The Sports Gene:
“One bookcase that is four inches wider than another will weigh only slightly more. But fill both cases with books and suddenly the little bit of extra width on the broader bookcase translates to a considerable amount of weight. Such is the case with the human skeleton.”
In measurements of thousands of elite athletes from soccer (football) to weight lifting, judo, rugby, and more, Holway has found that each kilogram (2.2 pounds) of bone supports a maximum of five kilograms (11 pounds) of muscle. Five-to-one, then, is a general limit of the human muscle bookcase. The limit for women is closer to 4.1 to 1.
Holway experimented on himself, spending years in heavy weight training with a diet high in protein and supplemented by creatine. But as he closed in on five-to-one, consuming more steaks and shakes only added fat, not muscle.
Muscle and bone are intrinsically linked. For example: They arise from the same stem cell line, they grow and strengthen in response to very similar hormonal signals in puberty, osteopenia (bone weakening) and sarcopenia (muscle weakening) with age are very closely associated, muscle contractions strengthen bone, there’s evidence that muscle and bone can “talk” directly to each other via paracrine hormones, and muscles even have receptors for hormones that were once thought to affect bone almost exclusively. The exact details of their molecular interactions are still being worked out, but it’s becoming more apparent that muscle and bone affect each other at a very basic level.
This notion also has empirical support. The size of someone’s frame correlates with how much fat free mass they have, and it’s been found that people who are more solidly-built prior to starting a training program gain more muscle and strength (assuming pre-training FFM corresponded to frame size in that study – a pretty safe assumption). Bone mass has also been used as a predictor for meat yield (aka muscle mass) from livestock since the 1930s.
Much like an FFMI of 25, however, a muscle:bone ratio above 5:1 doesn’t guarantee someone’s on steroids. Holway has drug-free athletes in his database with muscle:bone ratios nearing 5.5:1.
Muscle:bone ratio is a much better indicator of someone’s ability to gain muscle because it doesn’t only consider someone’s height (like FFMI and the Berkhan/Leangains model do); bone mass also reflects how wide and thick someone’s frame is. The guy who walks into the gym for the first time as wide as he is tall likely has more potential to gain muscle than the guy who’s the same height, but has an exomorphic appearance. FFMI only takes those two peoples’ heights into account, whereas muscle:bone ratio reflects the sizes of their entire frames.
Since Holway has thousands of athletes in his database, it’s less likely that a muscle:bone ratio above 5.5:1 will produce a “false positive” than an FFMI of 25 – indicating someone’s on drugs when they really aren’t.
Likewise, remember that ~50% of the steroid-users in the Kouri study had FFMIs below 25. A muscle:bone ratio of 5:1 also produces far fewer “false negatives” for people on drugs, but whose frames are too small to reach an FFMI of 25, even with the assistance of drugs.
Unfortunately, the method for measuring muscle and bone mass required by this model requires 22 separate measurements by a trained anthropometrist. An article & example of this can be found here:
Calculations on TBF, FFM, BMC & BMD Based on The Fels Longitudinal Study
In this study, data was used to investigate the relation between bicristal (between the Iliac Crests), elbow, knee, biacromial (between shoulders), and wrist breadths and measures of total body fat (TBF), fat-free mass (FFM), bone mineral content (BMC), and bone mineral density (BMD) from dual-energy X-ray absorptiometry.
Frame size is a descriptive term for skeletal size and robustness that together comprise the body’s supportive structure. Distributions or summations of the values of these bony breadths are used to categorise individuals as having small, medium, or large frames or to calculate indexes of frame size.
Despite the large number of possible bone measurements, categorisation of frame size is most frequently made by using measures of elbow breadth alone in relation to national reference data. These data consist of selected percentiles for elbow breadth within stature ranges for children and adults.
Classifying a person as having a small, medium, or large frame is intended to adjust for supposed skeletal mass and size in describing body composition or adjusting for ideal body weight. Measures of frame size are significantly and positively correlated with fat-free mass (FFM), body fatness, and bone mass and with body weight at all ages. These bone–body mass relations are also affected by the stress of muscle activity and the mechanical loading effects of gravity, which should be greatest at weight-bearing locations on the skeleton.
In light of these relations between frame size and body mass or body composition, it is reasonable to think that measures of large frame size, which reflect a large skeleton, are more strongly associated with a high bone mineral content (BMC) and a high bone mineral density (BMD) than people of small frame size. A high BMC and BMD should be necessary to support a large skeletal frame. Similarly, it is expected that a large skeletal frame would be associated with a greater amount of muscle and adipose tissue than would a small skeletal frame.
Broad shoulders typically represent a masculine physique, ie, greater muscularity, whereas broad hips represent a feminine physique, ie, greater adiposity. Thus, the associations between the breadths of the shoulders and hips and the amount of lean and fat tissue, respectively, reflect the basic sex differences in body size and composition. However, men with broad hips have a greater degree of adiposity than do men with narrow hips. What is not understood is whether the increased adiposity causes the broadening of the hips or whether broad hips allow for a greater ability to carry additional fat. The developmental aspects of these associations in childhood are an even greater mystery.
Wrist breadth is potentially the best discriminator of an association between frame size and amounts of fat and muscle, independent of stature. Broad wrists are negatively associated with TBF and positively associated with FFM and vice versa.
In a conducted study, wrist breadth was less correlated with TBF than were the other frame-size measures studied. In contrast, wrist breadth was significantly and negatively associated with TBF and significantly and positively associated with FFM in both the men and the women after adjustment for stature. This suggests that wrist breadth contributes information regarding the size of the upper appendages that is associated with amounts of fat and lean tissue. There may be some linkage between the breadths of the trunk and the wrists that is associated with amounts of lean and fat tissue in the body. However, elbow breadth, the customary measure of frame size, was not significantly associated with measures of body composition and bone mineral status, except for a limited association with TBF in the women. Elbow breadth was found to probably be more related to stature than it is to amounts of lean or fat tissue or bone.
The findings indicated that there is an intrinsic association between frame size and total body composition because adiposity and muscularity are positively associated with frame size, independent of stature. It is possible to have a high degree of muscularity and a large frame without a lot of adipose tissue, but the converse is not true. These findings also tend to support the idea that stress from a high degree of muscularity positively affects the size of the skeleton. However, similar stress from an excess of body fat would appear to have an opposite effect on skeletal size.
The men and women with large frames tended to have higher BMC than those with small frames, irrespective of age and stature. The frame-size measures explained a greater proportion of the variance in BMC than in BMD. These findings indicate that large frames are associated slightly with greater absolute amounts of bone than small frames but are not associated with the amount of bone per unit area. However, the men with broad shoulders and wrists and the women with broad shoulders and knees tended to have somewhat denser bones than the men and women with narrow shoulders, wrists, and knees.
On this same topic of frame size however, Peters DM & Eston R. comment that “The assessment of frame size is a problematic and ambiguous area.”
They conducted a similar study to above, to assess the level of agreement between various techniques of assessing frame size in a group of 27 healthy and active men aged 18-24 years, and also to assess which anthropometric variables were best associated with a measure of actual frame size (AFS).
Actual frame size was measured by the summation of a series of bone breadths, lengths and depths on a sub-sample of 17 men. The results of the study revealed substantial discordance between methods of assessing frame size. The variables which correlated most highly were body mass, ankle breadth, hand length and chest breadth, respectively.
What can I do about it?
How you can use this information for your own training and expectations
Here’s what we know: There’s a huge variability of responses to training, and the type of training people respond best to seems to vary as well.
However, there’s no easy and accurate way to know how well you’ll respond to training, or what type of training you’ll respond best to.
You never know how good of a hand you were dealt until you play it. Furthermore, you need to train consistently for at minimum four months before you can have a reasonable idea of how well you respond to a particular training program if you’re just starting out (you’ll probably have a good idea sooner if you’re more experienced). If you don’t respond well initially, you should try out at least 2-3 more programs with different programming styles to see if you simply didn’t respond well to the first style of training, while you may still respond very well to another style of training. This piece of advice applies to people who respond well to training too: Don’t be afraid to experiment with your training until you find a style that best suits your unique psychology and physiology.
Work closely with a qualified, experienced coach to get the best out of your genetics and potential.
If you don’t put in at least a year of consistent, challenging training with a good attitude and high expectations about your prospects, you probably aren’t justified in confidently claiming that you have bad genetics for lifting. Yes, your genetics may be to blame for lackluster results, but you shouldn’t be quick to jump to that conclusion and use it as an excuse. If you do so, you may just be turning it into a self-fulfilling prophecy and wind up squandering your potential.
Strength training has too many benefits to list (but some biggies include improved cognitive health, improved self-esteem, and decreased mortality risk), and many of them don’t necessarily depend on the hypertrophy and strength gains you make; many of them come from the process itself. Perhaps the biggest benefit is that continued strength training will help you age more gracefully; muscle strength and functionality tends to drop off faster with age than muscle mass itself, due somewhat to neurological changes, but primarily due to disuse (which also precipitates some of those neurological changes).
Continuing to lift may not help you build much more muscle and strength, but it will help you maintain muscle, strength, and functionality as you age.
It’s also worth noting that your “genetics” can improve over time. Not the actual genes themselves, but epigenetic factors (things that influence which genes get turned on and off) tend to change for the better in response to exercise, and along with/in addition to epigenetic factors, gene expression patterns, systemic inflammatory state, and your body’s hormonal environment tend to change and improve in response to training as well. All of these things can help you respond better to training.
References
https://www.strongerbyscience.com/your-drug-free-muscle-and-strength-potential-part-1/
http://ajcn.nutrition.org/content/75/6/1012.long
https://www.ncbi.nlm.nih.gov/pubmed/8450591
https://vitals.lifehacker.com/the-genetic-factors-that-determine-how-much-muscle-you-1789668889
https://www.strongerbyscience.com/genetics-and-strength-training-just-different/
https://www.ncbi.nlm.nih.gov/pubmed/21030674
https://www.medicalnewstoday.com/articles/235724.php
https://www.sciencedaily.com/releases/2011/10/111006173437.htm
https://www.livescience.com/16439-lowtestosterone-men-genetic-markers.html
https://www.ncbi.nlm.nih.gov/pmc/articles/PMC4445655/
https://www.strongerbyscience.com/pubmed-doesnt-replace-a-strength-coach/